
Squeezing More Inference from Apple Silicon: llama.cpp Today, MLXForge Later
This is Part 10 of the Local-First Agent Operations series. In Part 9, I followed a speech request across hosts and found that process context mattered as much as the network route. This installment moves one layer deeper, into the inference engine, where the word “slow” turns out to be just as ambiguous.
The first performance problem I tried to solve was not really one problem. A model could take too long to load, spend too much time ingesting a large prompt, wait behind another request, generate each new token slowly, or finish inference while the client still felt unresponsive. From the far end of an agent conversation, all of those delays looked much the same. Inside the system, they had different causes and needed different measurements.
That distinction matters more to me than a dramatic tokens-per-second screenshot. If I cannot identify which part of the request improved, I do not know what I changed. If I cannot prove that the baseline and candidate performed the same work correctly, I do not know whether I improved anything at all.
The runtime carrying that work today is llama.cpp on Apple Silicon. I run it behind the same kind of OpenAI-compatible boundary I use elsewhere in the stack, which means the agent does not need to know which engine is doing the work. MLXForge is the private successor I am developing behind that boundary, but it is undergoing a substantial refactor before production qualification and performance work can resume. I am discussing the measurement discipline here because it is useful now, not because MLXForge is ready to replace the runtime I already trust.
One Slow Response, Several Different Bottlenecks
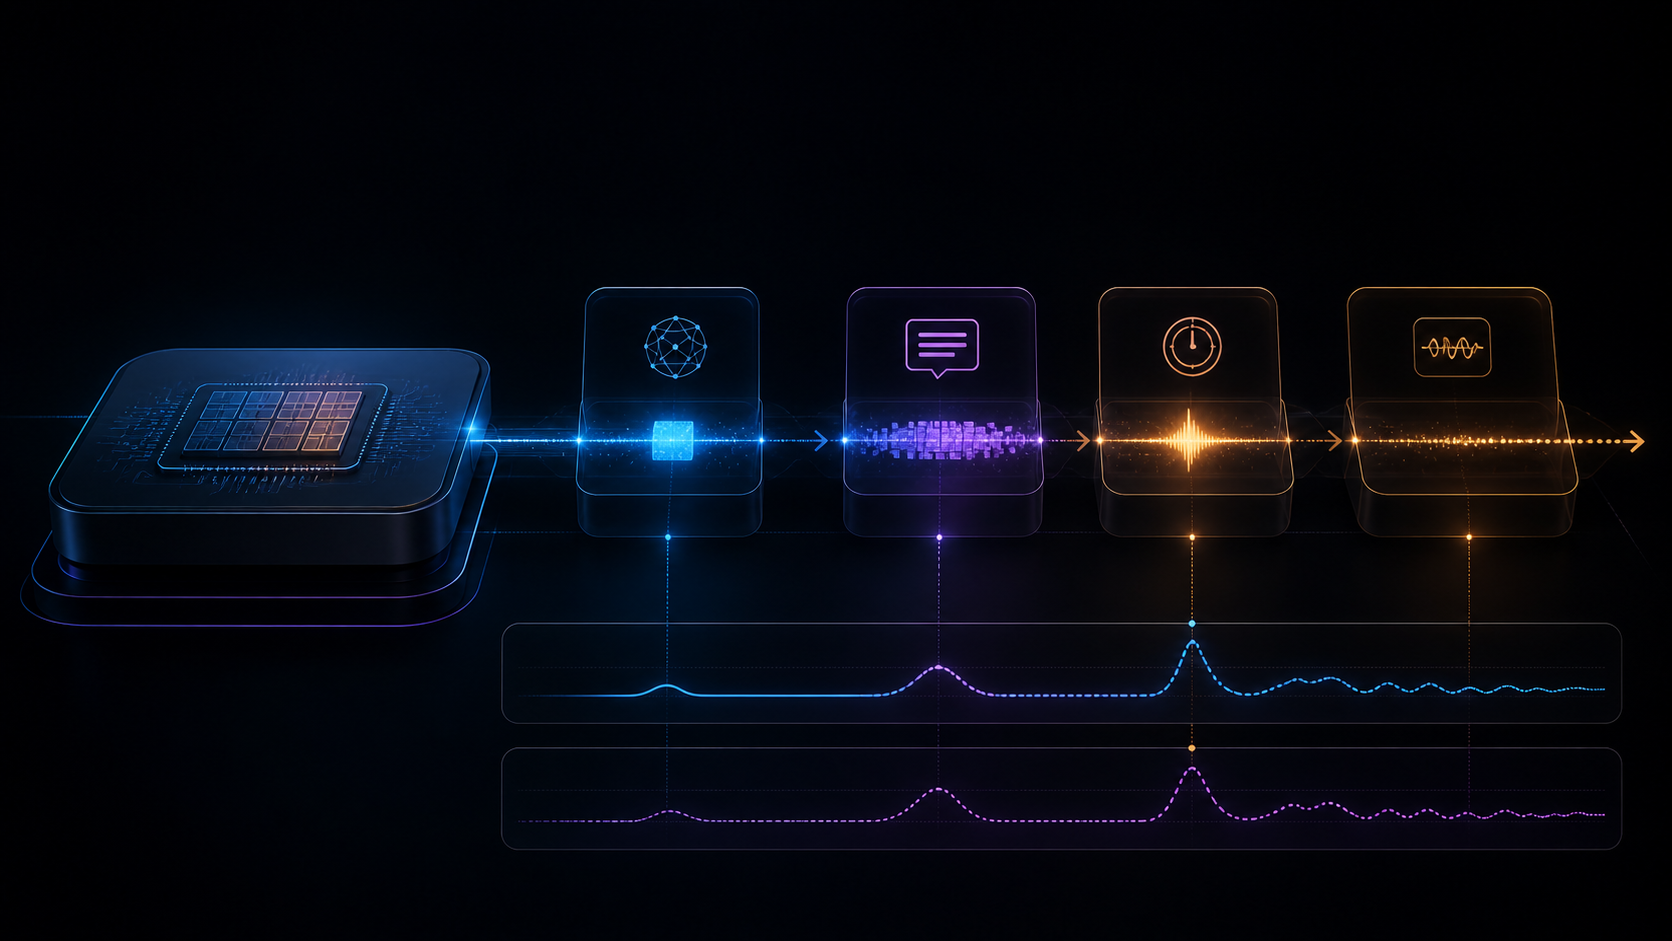
I now think about an inference request as a sequence of costs instead of one stopwatch reading. The model artifact begins somewhere on storage. Its pages have to become resident. The request may wait for admission. The engine processes the input, reaches the first generated token, continues decoding, transports the result, and eventually hands it to a client that still has its own work to do.

This decomposition stopped me from asking vague questions such as, “Why is the model slow?” The useful questions are narrower. Was this a cold load? How long did the request wait? How many input tokens were processed per second? Where was time to first token measured? What was the decode rate after generation began? Did the engine finish promptly while a proxy, network hop, or UI delayed presentation?
An optimization aimed at the wrong phase can make a report look better without making the agent feel better. Improving decode throughput will not rescue a workflow dominated by a cold model load. A faster storage device may help load time while doing nothing for steady-state decode. Batching may improve aggregate throughput while making one interactive request wait longer. Those are not contradictions. They are different experiments.
Unified Memory Is an Architecture, Not a Benchmark
Apple Silicon gives the CPU and GPU access to unified memory. That is a valuable architectural property, but I have learned not to turn it into a benchmark result by implication. The machine’s published memory bandwidth is not a promise that one model process will sustain that bandwidth, and storage throughput is not the same thing as model-load throughput.
Model weights can begin on internal or external storage. Mapped pages still need to become resident. Other applications can compete for memory capacity, bandwidth, and GPU time. Context growth changes the working set as a conversation continues. Kernel behavior, quantization, model geometry, cache layout, and concurrency all influence what the application actually does.
I keep the quantities separate because each answers a different question:
| Quantity | What it tells me | What it does not prove |
|---|---|---|
| Physical memory bandwidth | A hardware specification under defined conditions | Bandwidth available to one inference process |
| Storage throughput | Bytes moved from storage over time | Complete model-load or residency cost |
| Prompt throughput | Input tokens processed per second | Generated-token speed |
| Decode throughput | New tokens generated per second | First-token or end-to-end latency |
| Time to first token | Delay before the first token reaches the measurement point | Which earlier phase caused that delay |
| End-to-end latency | What the client experienced | That the engine consumed all of the time |
I use GB/s only when I actually have measured bytes and elapsed time for the same phase. Hardware specifications stay labeled as specifications. This sounds fussy until two people compare a storage number, a memory-bandwidth number, and a token rate as though they were interchangeable.
Prefill and Decode Are Different Workloads
Prompt prefill and token decode exercise the engine differently. Prefill processes the existing context, often in parallel across many input tokens. Decode produces new tokens incrementally and repeatedly revisits model state. A long conversation can therefore have a respectable decode rate and still feel slow because the engine spends most of the wait processing a large context before the first answer token appears.
Consider an invented example. Two warm runs both decode at roughly the same rate. One receives a short prompt and begins streaming quickly. The other receives a long agent transcript, waits in a queue, and has no reusable prompt state. Reporting only decode throughput makes the runs look equivalent even though the second user waits much longer for visible progress.
Model size and quantization can affect memory traffic and residency. Context length and KV-cache representation alter the working set. Batch shape and parallel requests change queueing and aggregate throughput. Prompt reuse may change prefill cost. Speculative or model-specific generation paths may change decode behavior. I want each of those changes recorded as a controlled condition, not smuggled into a single number called speed.
Correctness Comes Before Speed
The most important rule in my benchmark work is also the least glamorous: a faster wrong answer is not a performance improvement.
MLXForge’s deterministic harness separates correctness from informational performance reporting. A baseline and candidate can be checked against a fixed workload and a normalized output contract. The public lesson does not require retaining prompt text or generated text in a report. Workload fingerprints, normalized output hashes, token counts, timings, and bounded summaries can establish whether the intended comparison is still intact.
A hash has a deliberately narrow meaning. It can show that two normalized outputs are equal. It cannot tell me that the answer is useful, truthful, safe, or well written. Those need their own evaluation. For a deterministic regression, though, output drift is enough to stop the speed claim.
My rule is simple: if correctness fails, the result is not “faster.” It is a failed correctness comparison with no performance conclusion attached.
Comparable Means More Than the Same Model Name
Model names are convenient labels and poor identities. Two directories with the same name can contain different weights. Two engines can load different quantizations of nominally the same model. Prompt templates, sampling controls, context limits, caches, and token accounting can quietly change between runs.
For a defensible comparison I want, at minimum, a full artifact fingerprint, a semantic workload fingerprint, source identity, sampling identity, warm or cold state, profiling state, concurrency, batch size, context, machine class, memory capacity, and the same definition of every reported metric. I also want repetitions and a declared aggregation method. Relevant contention belongs in the experiment record because another GPU-heavy workload can invalidate an otherwise tidy comparison.
Matching configuration with the same source is a repeatability check. Matching configuration with a changed source can be an optimization comparison. A different artifact, workload, sampling contract, machine, or execution state is a different experiment unless I define and disclose that experiment explicitly.

Profiled runs are a good example. Profiling can reveal where time is spent, but the profiler changes execution. I use it as diagnostic evidence and do not mix it into an unprofiled throughput baseline. Warm and cold runs need the same separation. A cold-load experiment and a warm steady-state experiment are both useful, but averaging them together hides the thing I was trying to learn.
The Runtime I Use Today: llama.cpp
The current agent stack uses llama.cpp. That is not a placeholder hidden behind an apology. It is the qualified runtime doing the work now, and its OpenAI-compatible server gives me a stable boundary for clients, proxies, and test tools. If another engine eventually earns its place, I can change the implementation behind that boundary without teaching every client a new protocol.
My ordinary maintenance loop is fairly direct. I configure a host-specific build, run Make, and install it. If an update goes sideways, Time Machine is the practical rollback plan. That has worked for maintaining my own machine, but I would not pretend it is a complete evidence procedure for a public benchmark.
The configuration below is adapted for publication from the host-specific recipe I use. It preserves the explicit Unix Makefiles generator, Apple Clang compilers, macOS RPATH controls, shared-library layout, embedded Metal library, test-build choice, and disabled test installation. It documents one machine’s build and deployment intent. It is not a claim that every option makes inference faster or that this is the best build for every Mac.
cmake -S . -B build-m2max -G "Unix Makefiles" \
  -DCMAKE_BUILD_TYPE=Release \
  -DCMAKE_C_COMPILER=/usr/bin/clang \
  -DCMAKE_CXX_COMPILER=/usr/bin/clang++ \
  -DCMAKE_INSTALL_PREFIX=/usr/local \
  -DCMAKE_MACOSX_RPATH=ON \
  -DCMAKE_BUILD_WITH_INSTALL_RPATH=OFF \
  -DCMAKE_INSTALL_RPATH_USE_LINK_PATH=ON \
  -DCMAKE_INSTALL_RPATH='@executable_path/../lib;/usr/local/lib' \
  -DBUILD_SHARED_LIBS=ON \
  -DGGML_METAL=ON \
  -DGGML_METAL_EMBED_LIBRARY=ON \
  -DGGML_METAL_NDEBUG=ON \
  -DGGML_NATIVE=ON \
  -DGGML_LTO=ON \
  -DLLAMA_BUILD_SERVER=ON \
  -DLLAMA_BUILD_TOOLS=ON \
  -DLLAMA_BUILD_EXAMPLES=OFF \
  -DLLAMA_BUILD_TESTS=ON \
  -DLLAMA_TESTS_INSTALL=OFF

make -C build-m2max -j
make -C build-m2max install
Several details in that recipe are there to make the build’s intent visible. Metal is already the default on macOS, so spelling out GGML_METAL=ON documents the backend rather than proving an optimization. GGML_NATIVE=ON is also normally the local, non-cross-compiled default, but making it explicit warns me that the binary is tuned for the build host and should not be treated as portable. LTO is enabled, but I do not credit it with a throughput improvement unless a matched comparison demonstrates one.
The explicit compiler paths document the toolchain. The shared-library choice, /usr/local prefix, and RPATH controls are deployment decisions. They fit the way this machine is operated; they are not performance settings. The embedded Metal library removes a separate runtime shader-file dependency. Building tests while declining to install them keeps validation available in the build tree without adding test programs to the installed toolset. A versioned prefix or a user-owned installation directory may be the better choice on another system.
For a Reproducible Benchmark or Public Tutorial
For published measurements, a faster personal loop is not enough. I would record the source identity, use a bounded build, run the relevant tests, identify the resulting binary, and install only after those checks pass:
git rev-parse HEAD

cmake --build build-m2max --config Release \
  --parallel "$(sysctl -n hw.logicalcpu)"

ctest --test-dir build-m2max -L main \
  --output-on-failure --timeout 900

build-m2max/bin/llama-server --version

# Only after the build and tests have passed:
cmake --install build-m2max --config Release
That identity discipline connects directly to the fail-closed comparator in Hands-On 10A. I can build and identify the engine I use now. A future engine becomes comparable only when its correctness, artifact identity, workload, and execution conditions match closely enough to support the comparison.
Where MLXForge Fits Later
MLXForge has an MLX-native engine, OpenAI-compatible serving surfaces, model loading and generation, embeddings, conversion and metadata work, local statistics, deterministic prompt suites, persisted run artifacts, artifact and workload identities, and rolling regression mechanics. Those pieces describe the development and measurement foundation. They do not make it the production runtime.
The run identity records details such as source, artifact, semantic workload, and warm or cold state. Offline analysis refuses performance comparability when required identity is incomplete. Profiled runs remain diagnostic rather than throughput baselines. The benchmark area also says plainly that much of the larger benchmark catalog is not implemented yet.
That boundary matters. MLXForge is still private, unfinished, and in substantial refactoring before production qualification. Current warm-runtime development is unaccepted working-tree work. None of that establishes a beta, a release, or an advantage over llama.cpp. I will return to MLXForge in the series after the refactor, qualification, and repeatable benchmark evidence are complete, because that is the point when a comparison can say something useful.
The later optimization milestones remain questions I intend to answer with evidence:
| Planned area | Question the work must answer |
|---|---|
| Scheduling and batching | Can aggregate work improve without unacceptable request latency or correctness drift? |
| Hot cache | What state can remain resident, and what identity and invalidation rules make reuse safe? |
| Warm restore | Can persisted state reduce startup or prefill cost without stale or cross-session contamination? |
| Advanced generation | Does a model-specific or draft path improve useful decode throughput under matched correctness checks? |
| Promotion policy | What repeatable correctness, resource, rollback, and performance evidence is sufficient for adoption? |
Those are design goals, not shipped-feature claims.
Compare Engines Through a Contract, Not a Label
An OpenAI-compatible interface gives me a useful stable client boundary. I can point the same test client and workload machinery at an MLX engine or a llama.cpp server without rewriting the agent. That is operationally valuable, but API compatibility does not make the internal engines or their model artifacts equivalent.
A serious cross-engine comparison still has to disclose how model content and quantization were matched, which prompt template was used, how tokens were counted, what sampling settings were applied, whether caches were warm, what concurrency was present, and whether the normalized outputs satisfied the same contract. If exact artifact identity cannot cross formats, the experiment needs a carefully justified equivalence rule instead of a hand wave around a model name.
I would not publish a winner from one run. Three accepted repetitions are a useful minimum for a small engineering check, but even then I would report the aggregation and spread and avoid claiming statistical significance. Cold and warm results remain separate. The result should be reproducible enough that a later run can disagree with it honestly.
Optimize the Existing Machine Before Replacing It
It is tempting to treat new hardware as the universal performance fix, especially when the next machine has more memory or a larger published bandwidth figure. I would rather make the bottleneck earn that purchase.
I start by finding the dominant phase. Then I remove avoidable client delay and competing GPU work, verify storage placement and cold-load behavior, and inspect model size, quantization, context, and cache configuration. Once correctness baselines exist, I can measure prompt reuse, caching, scheduling, or an engine change under matched conditions. Hardware comes last, when the measured limitation maps to a resource the replacement materially improves.
Sometimes that analysis will still point to a larger machine. A model may simply need more memory, a workload may be limited by sustained memory traffic, or concurrency may exceed the current system’s useful capacity. The difference is that the purchase follows evidence instead of standing in for it.
Try the Comparator Without a Model
Hands-On 10A: Build a Fail-Closed Inference Benchmark Comparator turns the comparison contract into a small standard-library lab. It uses invented baseline and candidate bundles, rejects incompatible identity and execution state, blocks metrics after correctness failure, and produces bounded JSON, TSV, and Markdown reports.
It does not need MLXForge, Apple Silicon, a GPU, a model, or a network service. The synthetic measurements prove only that the comparator behaves as designed. That makes it safe to inspect, change, and break while learning why benchmark eligibility belongs before arithmetic.
Current State
The current agent stack uses llama.cpp as its qualified Apple Silicon inference runtime behind an OpenAI-compatible boundary. My ordinary local maintenance loop remains deliberately direct. The separate publication workflow records the source and binary identities needed to keep later measurements attached to the engine that produced them. Neither workflow establishes that one build flag or the complete recipe improves performance.
MLXForge’s measurement foundation includes deterministic prompt runs, correctness and performance separation, persisted run identity, workload and artifact fingerprints, local statistics, and rolling comparison mechanics. The private repository is under substantial refactoring before production qualification and later performance work. Current warm-runtime work is not accepted evidence.
No benchmark number in this article came from a private MLXForge run. No claim here establishes that MLX is universally faster than llama.cpp, that one Apple Silicon configuration is the best purchase, or that MLXForge is publicly available.
Next Work
The immediate operational work is to keep the llama.cpp build reproducible and preserve a trustworthy measurement baseline. MLXForge needs to complete its refactor and production qualification before it becomes a serious replacement candidate. Scheduler and batching, hot-cache behavior, warm restoration, advanced model paths, and formal promotion thresholds remain research goals with their own review checkpoints, not promises about the next build.
When real Apple Silicon results are ready for publication, they will need a frozen source revision, matched run identity, retained correctness evidence, repeated observations, disclosed aggregation, and a privacy-safe evidence package. Until then, the comparator contract is the useful result: measure the phase that is actually slow, refuse comparisons that changed underneath you, and do not let a fast number outrun what the evidence proves.
Join the Discussion
Comments for this post live in GitHub Discussions. That keeps moderation in one place and gives the conversation a stable home.