
A Passive Model Proxy as an AI Debugging Instrument
On this page
I reached a point in this work where looking at the JSON request was no longer enough. The messages appeared to be in the right order, the tools were present, and the model endpoint was answering. Still, the answer occasionally made me wonder what the model had actually been asked.
That distinction matters. An OpenAI-compatible request contains structured messages, tool definitions, options, and perhaps multimodal content. The model does not consume that envelope directly. A chat template turns it into the token-bearing prompt the model sees. If that transformation duplicates a tool result, mishandles a role boundary, omits a generation marker, or carries too much history forward, the request can look perfectly reasonable while the rendered prompt is wrong.
I needed to see both. I also wanted to see the response as it crossed the same boundary, including streaming fragments and tool calls, without placing a clever new component in the path that quietly changed the evidence. That is why the model proxy became useful to me as a debugging instrument rather than another optimization layer.
Three Views of the Same Exchange
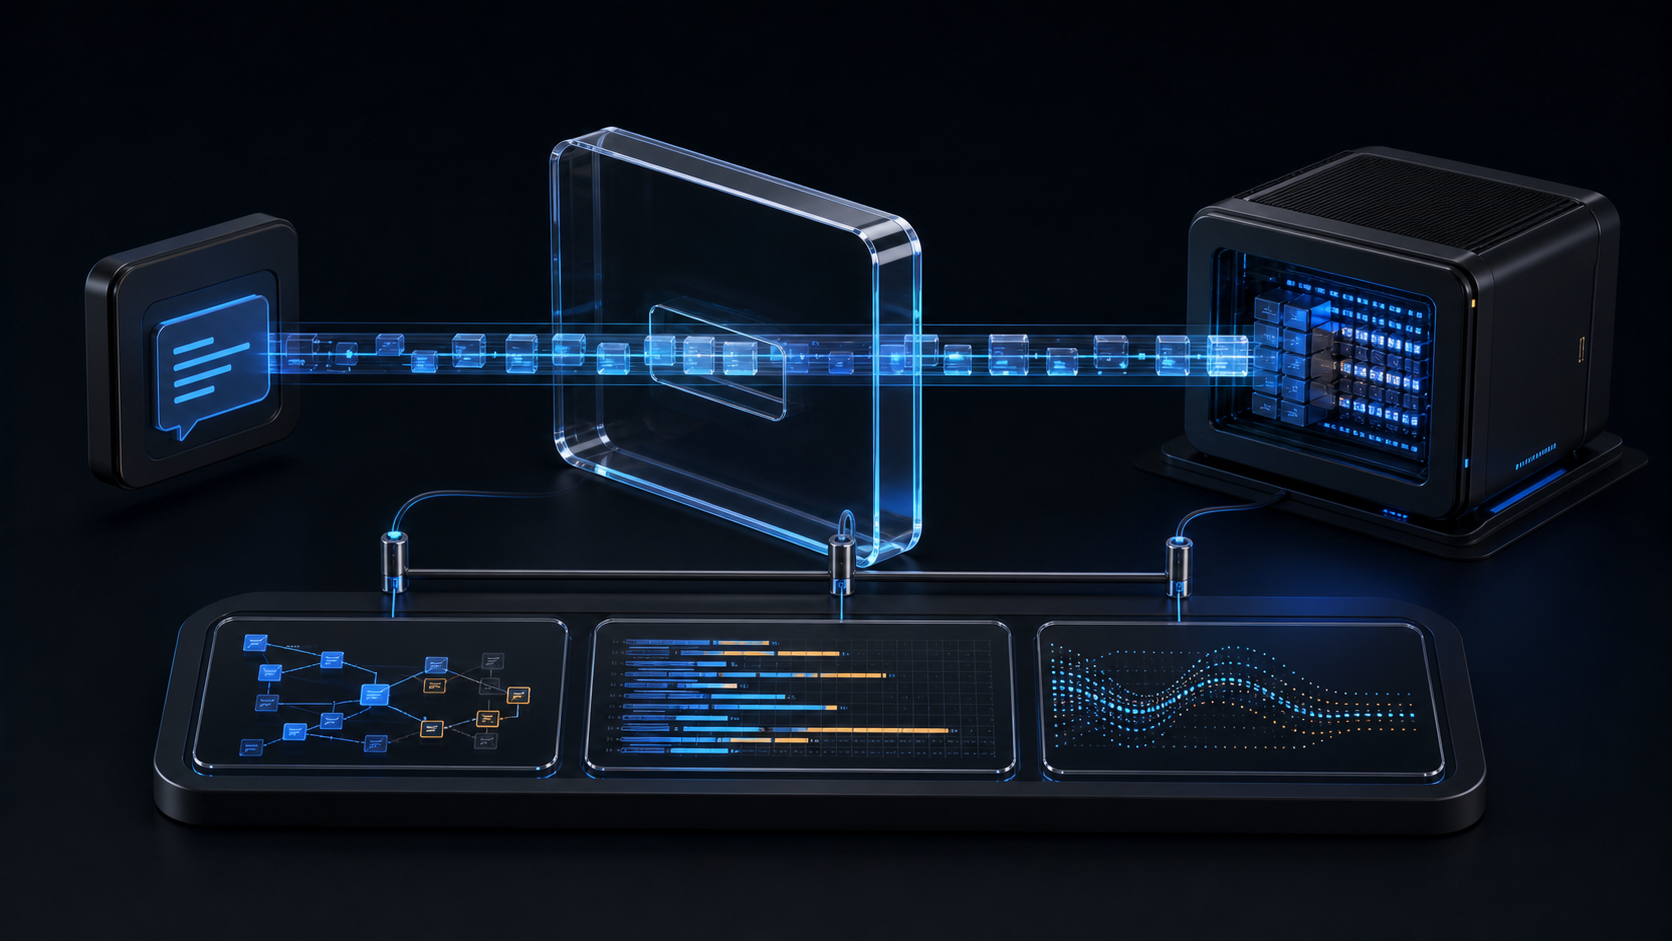
I think of a model exchange as having three related views, and each answers a different question.
| View | What it tells me | What it can hide |
|---|---|---|
| Raw structured request | What the caller submitted: messages, tools, options, and request shape | The exact prompt produced by the model’s chat template |
| Rendered prompt | The role markers, tool syntax, media placeholders, and generation boundary the template produced | The original transport representation and the exact bytes sent by the caller |
| Raw textual and reconstructed response | What the UTF-8 JSON or SSE response body contained, plus coherent content, reasoning, tool calls, usage, and finish state | Why the prompt was constructed that way |
None of these is the complete truth by itself. The useful part is being able to correlate all three with one request ID. When an exchange takes a long time, the proxy writes and flushes the request-side diagnostic before the response has completed. I can begin inspecting the prompt while the model is still working rather than waiting for the whole exchange to finish.
That sounds like a small operational detail until the model call is the thing that is stuck. A diagnostic record that only appears after success is not much help while diagnosing a hang.

The Rule That Makes the Evidence Trustworthy
The proxy has one rule I consider non-negotiable: diagnostic work must not change the request forwarded upstream.
The original request body is sent to the configured model endpoint. The original response body bytes are returned to the caller. Prompt rendering happens beside that path and exists only to explain what the selected template would produce. There is no request-rewrite mode hidden behind a convenient option, and the rendered output never feeds back into transport. The proxy filters or regenerates HTTP headers and framing, so this is a body-preservation claim rather than a claim that every response byte on the wire remains identical.
That boundary is the reason I can trust what I see. If an observability component also edits the prompt, I have created a different experiment. Perhaps the edit is useful, but I can no longer say that I merely observed the failure. The measuring instrument has become part of the behavior under test.
This became especially important as I worked on context hygiene. The correct place for deliberate prompt filtering was the selected Jinja chat template, where the policy could be reviewed and tested as template behavior. The proxy remained passive. That separation gives me a clean comparison: the raw request shows what arrived, the rendered view shows what the template selected, and the transport path proves that the proxy itself did not rewrite the envelope.
What I Can See in a Rendered Prompt
Rendered prompts turn several vague model problems into ordinary engineering problems. I can inspect delimiters, count repeated blocks, find a tool response without its matching call, and see whether the assistant generation marker is in the right place. Context growth stops being a feeling and becomes visible text with identifiable causes.
Tool calls are a good example. Different clients may represent tool arguments as an object or as an encoded JSON string. The diagnostic renderer normalizes that shape for the template, which lets the template validate what it received consistently. It also provides the Hugging Face-style raise_exception helper used by some shipped templates. A malformed sequence can fail with a useful rendering error rather than producing a misleading approximation of the prompt.
That does not mean every request body should be treated as a chat. Model discovery and other body-bearing calls may pass through the same HTTP service. The proxy now records those as explicit rendering skips instead of claiming that a missing messages array is a chat-template failure. This distinction has saved me from chasing errors that were really just the observer applying the wrong interpretation.
The rendered response side has a similar job. A streaming response may split visible content, reasoning, tool-call names, and tool arguments across many SSE frames. Reading one network fragment at a time is possible, but it is a miserable way to understand the exchange. For the OpenAI-compatible JSON and SSE traffic under discussion, the proxy retains a raw textual body view decoded as UTF-8 with replacement behavior while reconstructing a human-readable view with finish reason, usage, timing, and an explicit HTTP or SSE completion boundary. This is useful application-level evidence, not an arbitrary binary forensic capture. I get a coherent diagnostic without changing the response body delivered to the client.
Failure Reasons Need the Same Discipline
Once a proxy sits between an agent and a model, it becomes tempting to blame it for every failure nearby. Good diagnostics have to resist that temptation.
An upstream service can reject a request. The proxy can fail before it reaches the service. A client can disconnect while the proxy is still waiting for upstream response headers. Those events may look alike from a distance, but they imply different repairs. The current implementation classifies an early client disconnect as a canceled exchange rather than manufacturing a proxy HTTP 500 and then displaying a broken-pipe artifact as though it came from the model.
This is one of the reasons I care about preserving the raw boundary and recording the derived explanation separately. I want the evidence to tell me which component owned the last successful transition. If the caller went away, I should not spend an afternoon debugging a model response that never had a client waiting to receive it.
The same principle applies to degraded operation. A proxy process can be alive while its configured upstream is unavailable. That is running and degraded, not stopped. Process state, route health, and request success are separate facts, and the logs need to keep them separate.
Rotation Behavior Is Part of the Operator Interface
I used to think of log rotation as housekeeping. With long-running model calls and live monitoring, it becomes an interface contract.
A monitoring process may be tailing the active raw or rendered log while another tool displays it. Renaming the live file and opening a new one can leave an existing reader attached to the old inode. The operator sees a path that looks current while an inode-following reader quietly watches the rotated file.
The proxy diagnostic writer uses timed numbered rename rotation. At the rotation boundary, older numbered files are shifted, the active file is renamed to .0.log, and the next write creates a new active file at the configured path. The active inode therefore changes. A reader that needs to survive rotation must follow the filename and reopen it rather than assuming an existing descriptor will continue receiving new exchanges.
The toolkit also has copy-and-truncate helpers for wrapper-managed service and model log maintenance, but those helpers do not replace the proxy tap’s in-process rotation. Keeping those two mechanisms distinct is not glamorous documentation work, yet it determines whether monitoring remains trustworthy after a rotation boundary.
Stable paths also make the command surface simpler. The wrapper can expose status, health, raw logs, rendered logs, a render operation for captured input, and rotation controls without asking every monitoring consumer to understand the proxy process internals.
Detailed Diagnostics Are Sensitive by Design
There is an uncomfortable privacy truth here: a useful prompt diagnostic may contain almost everything I do not want to publish.
Raw requests can hold system prompts, conversation history, tool definitions, authorization context, customer material, private paths, and encoded media. Rendered prompts can contain the same information in a form that is easier to read. Reconstructed responses may include model reasoning, visible replies, tool arguments, and generated artifacts. Redacting credential headers is necessary, but it does not turn those records into harmless telemetry.
I treat the detailed logs as incident evidence. They need restricted access, deliberate retention, protected file permissions, and deletion rules that match the sensitivity of the work. They should not be copied into a general dashboard simply because NDJSON is convenient to ingest.
Ordinary operational monitoring needs a different record. A content-free metric event can retain the timestamp, request ID, HTTP method, a bounded route class, request and response byte counts, status, duration, and an exception class. It must not retain an arbitrary URL path because variable segments can contain session identifiers, tenant names, or document IDs even when the query string is removed. The bounded record is still enough to answer several useful questions: Is traffic reaching the proxy? Are responses getting larger? Is latency changing? Are upstream failures increasing? It does not answer why a particular prompt went wrong, but that is precisely why it is safer to retain for routine observation.
These two modes should coexist rather than being confused:
| Operational need | Evidence | Retention posture |
|---|---|---|
| Routine health and trend monitoring | Content-free sizes, timing, status, route class, and error class | Longer retention can be considered, with access still controlled |
| Prompt or tool-call diagnosis | Raw textual request body, rendered prompt, raw textual response body, and reconstructed exchange | Short, explicit retention with narrow access |
| Publication or external reporting | Aggregated sanitized measures and invented examples | No private exchange content |
The production proxy already provides the detailed evidence. A separate content-free production stream remains next work. I am being precise about that because it would be easy to call the existing machine-readable log “metrics” and accidentally imply it contains no prompt or response content. It does.
A Hands-On Lab That Proves the Boundary
I wanted this installment to offer more than an architecture discussion, so I built a small standard-library lab for the Hands-On companion. It contains a passive proxy, a deterministic fake model endpoint, and six regression tests. The tests prove that the request body reaches the fake upstream unchanged, the response body returns unchanged, authorization, query, and path-segment canaries do not enter the metrics file, a pre-existing permissive metric file is restricted before append, an unavailable upstream becomes a sanitized 502 record, credential-bearing upstream URLs are rejected, and a remote upstream requires an explicit opt-in.
The lab is intentionally smaller than the production component. It buffers responses and omits streaming passthrough, TLS termination, authentication, rotation, and service supervision. Those omissions are part of the lesson. A compact teaching artifact can prove the passive boundary and privacy canaries without pretending to be a gateway someone should expose on a network.
The companion, Hands-On 6A: Build and Test a Passive Proxy Lab, walks through running the tests, starting the fake endpoint and proxy in separate terminals, sending an invented request, reading the content-free JSONL record, and forcing an upstream failure. It also includes questions readers can use to extend the experiment safely.
What I like about this lab is that the useful result is not a screenshot. It is a set of executable claims. Readers can change the request whitespace, add a fake authorization header, or put a marker in the query string and watch the tests prove which bytes are forwarded and which values are excluded from the retained metrics.
Current State
The LLM-Ops-Kit proxy implements a passive forwarding path with separate raw textual request-body, rendered-prompt, raw textual response-body, and reconstructed response diagnostics for the JSON and SSE traffic under discussion. The source and regression suite support request-ID correlation, immediate request-side flushing, streaming reconstruction, template validation helpers, non-chat skip classification, client-disconnect handling, and timed numbered rename rotation. Monitoring readers must reopen the active filename after rotation because its inode changes.
The permitted sources do not establish that the proxy is carrying traffic in my current environment, so I am not making that deployment claim here. The new Hands-On proxy, fake endpoint, and six tests passed acceptance before publication. They are teaching artifacts, not a publicly supported production gateway.
Next Work
The most useful production addition would be a separate content-free metric stream with explicit retention and access policy. That would let routine monitoring stay away from prompt and response content while preserving the detailed logs for bounded diagnostic work.
The correlated exchange browser remains deferred. When it is built, it should preserve the same separation: request IDs may connect the views, but the interface must make sensitivity and retention visible rather than encouraging casual browsing through private conversations. The broader final-artifact acceptance matrix also needs to be repeated before release claims are made.
For the series, the next installment follows the template boundary into a specific case: multimodal context hygiene, where old images and media-producing tool exchanges can consume context long after they have stopped helping the model. I will publish the attributed Qwen media-history Jinja template with that article, along with its stock fallback, sanitized fixtures, expected results, checksums, Apache-2.0 license, and rollback instructions. Readers using Hermes with a matching Qwen route will have something concrete to test rather than only a description of the policy.
Join the Discussion
Comments for this post live in GitHub Discussions. That keeps moderation in one place and gives the conversation a stable home.